Configuring an ELK Stack Part 1
In this article, I’ll be configuring ELK stack in docker. This will be 2 part series where first one will focus on configuring base ELK and second one more advanced stuff.
I’m following the official Elastic guide on setting it up in docker using docker-compose.
Let’s begin.
File structure
First thing, I’m going to create initial file structure for docker, where Kibana, Metricbeat and Logstash will be able to use these files.
touch .env docker-compose.yml filebeat.yml logstash.conf metricbeat.ymltree -la
.
├── docker-compose.yml
├── .env
├── filebeat.yml
├── logstash.conf
└── metricbeat.yml
1 directory, 5 filesConfiguration files
Next, I’m going to configure files that were just created
.env
# Project name (if not set, select cwd)
#COMPOSE_PROJECT_NAME=elk-stack

# Password for the 'elastic' user(min 6 characters)
ELASTIC_PASSWORD=elpass

# Password for the 'kibana_system' user(min 6 characters)
KIBANA_PASSWORD=kipass

# Version of Elastic products
STACK_VERSION=8.7.1

# Cluster name
CLUSTER_NAME=docker-cluster

# set license to 'basic' or 'trial' for 30-day trial
LICENSE=basic

# Port to expose Elasticsearch HTTP API to the host
ES_PORT=9200

# Port to expose Kibana to the host
KIBANA_PORT=5601

# Available host memory for each service in bytes (1GB)
ES_MEM_LIMIT=1073741824
KB_MEM_LIMIT=1073741824
LS_MEM_LIMIT=1073741824

# Sample predefined key only for testing environments
ENCRYPTION_KEY=c34d38b3a14956121ff2170e5030b471551370178f43e5626eec58b04a30fae2
Here, I configure all the necessary variables for elastic to work properly, like passwords, ports, memory limits and so on.
All of the variables that can be configured can be found at Elastic docs
Base Setup
docker-compose.yml (‘setup’ container)
Note: From this point on, make sure syntax is correct in these configuration files. especially spelling and indentation. Otherwise docker will not setup the containers.
version: "3.8" // This is deprecated. you can just remove this line

volumes:
 certs:
  driver: local
 esdata01:
  driver: local
 kibanadata:
  driver: local
 metricbeatdata01:
  driver: local
 filebeatdata01:
  driver: local
 logstashdata01:
  driver: local

networks:
 default:
   name: elastic-network
   external: false

services:
 setup:
   image: docker.elastic.co/elasticsearch/elasticsearch:${STACK_VERSION}
   volumes:
     - certs:/usr/share/elasticsearch/config/certs
   user: "0"
   command: >
     bash -c '
       if [ x${ELASTIC_PASSWORD} == x ]; then
         echo "Set the ELASTIC_PASSWORD environment variable in the .env file";
         exit 1;
       elif [ x${KIBANA_PASSWORD} == x ]; then
         echo "Set the KIBANA_PASSWORD environment variable in the .env file";
         exit 1;
       fi;
       if [ ! -f config/certs/ca.zip ]; then
         echo "Creating CA";
         bin/elasticsearch-certutil ca --silent --pem -out config/certs/ca.zip;
         unzip config/certs/ca.zip -d config/certs;
       fi;
       if [ ! -f config/certs/certs.zip ]; then
         echo "Creating certs";
         echo -ne \
         "instances:\n"\
         "  - name: es01\n"\
         "    dns:\n"\
         "      - es01\n"\
         "      - localhost\n"\
         "    ip:\n"\
         "      - 127.0.0.1\n"\
         "  - name: kibana\n"\
         "    dns:\n"\
         "      - kibana\n"\
         "      - localhost\n"\
         "    ip:\n"\
         "      - 127.0.0.1\n"\
         > config/certs/instances.yml;
         bin/elasticsearch-certutil cert --silent --pem -out config/certs/certs.zip --in config/certs/instances.yml --ca-cert config/certs/ca/ca.crt --ca-key config/certs/ca/ca.key;
         unzip config/certs/certs.zip -d config/certs;
       fi;
       echo "Setting file permissions"
       chown -R root:root config/certs;
       find . -type d -exec chmod 750 \{\} \;;
       find . -type f -exec chmod 640 \{\} \;;
       echo "Waiting for Elasticsearch availability";
       until curl -s --cacert config/certs/ca/ca.crt https://es01:9200 | grep -q "missing authentication credentials"; do sleep 30; done;
       echo "Setting kibana_system password";
       until curl -s -X POST --cacert config/certs/ca/ca.crt -u "elastic:${ELASTIC_PASSWORD}" -H "Content-Type: application/json" https://es01:9200/_security/user/kibana_system/_password -d "{\"password\":\"${KIBANA_PASSWORD}\"}" | grep -q "^{}"; do sleep 10; done;
       echo "All done!";
     '
   healthcheck:
     test: ["CMD-SHELL", "[ -f config/certs/es01/es01.crt ]"]
     interval: 1s
     timeout: 5s
     retries: 120
This is a base setup for docker compose where storage volume path, network and services are enabled and specified.
Elasticsearch
Here, I setup elasticsearch
docker-compose.yml
Add the following to docker-compose.yml
 es01:
   depends_on:
     setup:
       condition: service_healthy
   image: docker.elastic.co/elasticsearch/elasticsearch:${STACK_VERSION}
   labels:
     co.elastic.logs/module: elasticsearch
   volumes:
     - certs:/usr/share/elasticsearch/config/certs
     - esdata01:/usr/share/elasticsearch/data
   ports:
     - ${ES_PORT}:9200
   environment:
     - node.name=es01
     - cluster.name=${CLUSTER_NAME}
     - discovery.type=single-node
     - ELASTIC_PASSWORD=${ELASTIC_PASSWORD}
     - bootstrap.memory_lock=true
     - xpack.security.enabled=true
     - xpack.security.http.ssl.enabled=true
     - xpack.security.http.ssl.key=certs/es01/es01.key
     - xpack.security.http.ssl.certificate=certs/es01/es01.crt
     - xpack.security.http.ssl.certificate_authorities=certs/ca/ca.crt
     - xpack.security.transport.ssl.enabled=true
     - xpack.security.transport.ssl.key=certs/es01/es01.key
     - xpack.security.transport.ssl.certificate=certs/es01/es01.crt
     - xpack.security.transport.ssl.certificate_authorities=certs/ca/ca.crt
     - xpack.security.transport.ssl.verification_mode=certificate
     - xpack.license.self_generated.type=${LICENSE}
   mem_limit: ${ES_MEM_LIMIT}
   ulimits:
     memlock:
       soft: -1
       hard: -1
   healthcheck:
     test:
       [
         "CMD-SHELL",
         "curl -s --cacert config/certs/ca/ca.crt https://localhost:9200 | grep -q 'missing authentication credentials'",
       ]
     interval: 10s
     timeout: 10s
     retries: 120
This is docker cluster configuration, where CA certificate and node path is specified. In this case Elasticsearch data and certifications are not stored in docker container. Instead they will be saved in local storage for data persistence and robustness.
  volumes:
     - certs:/usr/share/elasticsearch/config/certs
     - esdata01:/usr/share/elasticsearch/data
With both these configurations set up, now I can perform docker compose up command to create and run containers.
Note: docker compose up command should be run in the folder where docker-compose.yml resides.
Here’s my example:
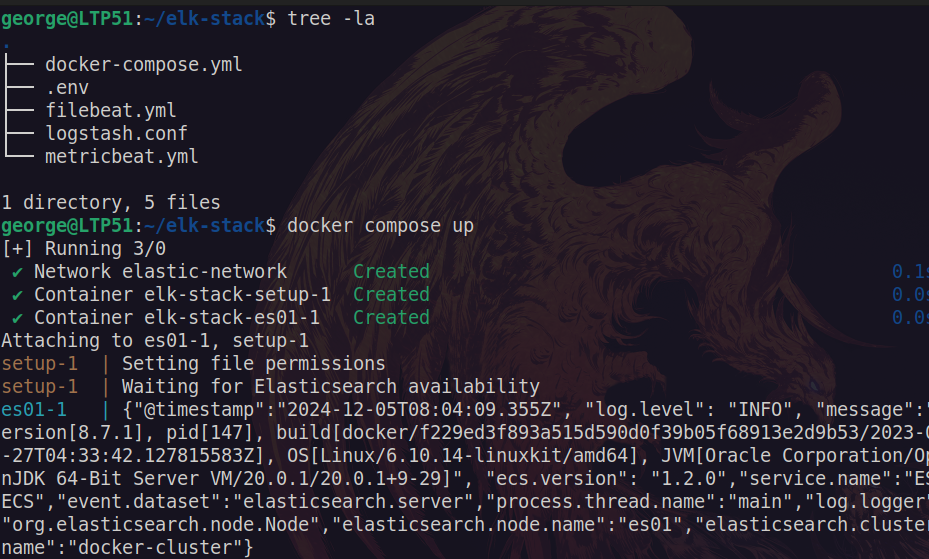
Here you can see that elastic-network and container has successfully run.
In case you need docker composer commands, here are a few useful ones:
| Command | Description |
|---|---|
| docker compose up | Created and starts all containers within docker-compose.yml |
| docker compose down | Stops all containers and removes any networks relating to docker-compose.yml. Leaves Volumes intact and allows generated data to persist between builds |
| docker compose down -v | Same as above and removes Volumes. basically starting over. |
| docker compose start | starts existing containers |
| docker compose stop | Stops all containers. same as CTRL+C |
Copying valid certificates
Now that the system is up and running I need to make sure that valid certificates for docker container is present in my local machine.
Here I copy certificate from docker machine to /tmp/ folder.
docker cp elk-stack-es01-1:/usr/share/elasticsearch/config/certs/ca/ca.crt /tmp/.now let’s test it.
curl --cacert /tmp/ca.crt -u elastic:elpass https://localhost:9200Successful response:
{
  "name" : "es01",
  "cluster_name" : "docker-cluster",
  "cluster_uuid" : "ItB3TTyJTMqX5K6McWGaCw",
  "version" : {
    "number" : "8.7.1",
    "build_flavor" : "default",
    "build_type" : "docker",
    "build_hash" : "f229ed3f893a515d590d0f39b05f68913e2d9b53",
    "build_date" : "2023-04-27T04:33:42.127815583Z",
    "build_snapshot" : false,
    "lucene_version" : "9.5.0",
    "minimum_wire_compatibility_version" : "7.17.0",
    "minimum_index_compatibility_version" : "7.0.0"
  },
  "tagline" : "You Know, for Search"
}
Notice that we can access elasticsearch using localhost:9200.
Kibana
docker-compose.yml
Now I can add Kibana container config in docker-compose.yml and specify that it should run after Elasticsearch node.
Add the following to docker-compose.yml
 kibana:
   depends_on:
     es01:
       condition: service_healthy
   image: docker.elastic.co/kibana/kibana:${STACK_VERSION}
   labels:
     co.elastic.logs/module: kibana
   volumes:
     - certs:/usr/share/kibana/config/certs
     - kibanadata:/usr/share/kibana/data
   ports:
     - ${KIBANA_PORT}:5601
   environment:
     - SERVERNAME=kibana
     - ELASTICSEARCH_HOSTS=https://es01:9200
     - ELASTICSEARCH_USERNAME=kibana_system
     - ELASTICSEARCH_PASSWORD=${KIBANA_PASSWORD}
     - ELASTICSEARCH_SSL_CERTIFICATEAUTHORITIES=config/certs/ca/ca.crt
     - XPACK_SECURITY_ENCRYPTIONKEY=${ENCRYPTION_KEY}
     - XPACK_ENCRYPTEDSAVEDOBJECTS_ENCRYPTIONKEY=${ENCRYPTION_KEY}
     - XPACK_REPORTING_ENCRYPTIONKEY=${ENCRYPTION_KEY}
   mem_limit: ${KB_MEM_LIMIT}
   healthcheck:
     test:
       [
         "CMD-SHELL",
         "curl -s -I http://localhost:5601 | grep -q 'HTTP/1.1 302 Found'",
       ]
     interval: 10s
     timeout: 10s
     retries: 120
Now you can either use Docker Desktop to enable Kibana container or just use terminal CTLR+C your container and rerun docker compose up
Now, open up browser and go to localhost:5601 to see your elastic up and running.
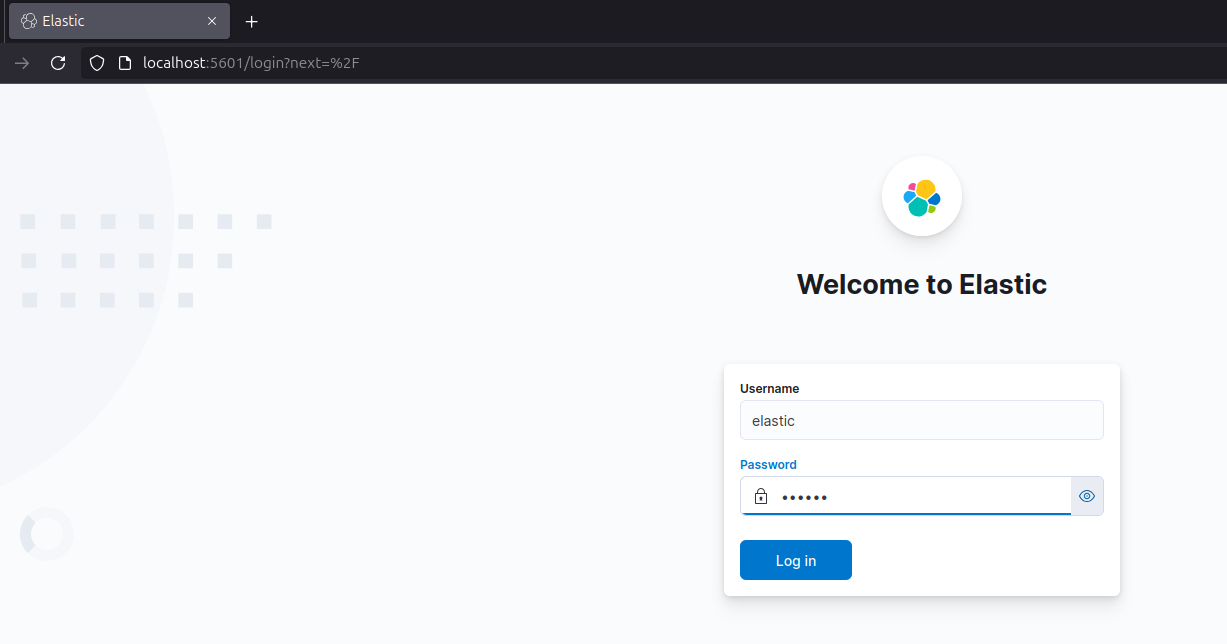
Awesome! Now try logging in with credentials that was specified in .env file. It should log in without any problems.
Metricbeat
docker-compose.yml
Now that Kibana and Elasticsearch are running and communicating, I can continue and setup Metricbeat same as Kibana before.
- Add the following to
docker-compose.yml
 metricbeat01:
   depends_on:
     es01:
       condition: service_healthy
     kibana:
       condition: service_healthy
   image: docker.elastic.co/beats/metricbeat:${STACK_VERSION}
   user: root
   volumes:
     - certs:/usr/share/metricbeat/certs
     - metricbeatdata01:/usr/share/metricbeat/data
     - "./metricbeat.yml:/usr/share/metricbeat/metricbeat.yml:ro"
     - "/var/run/docker.sock:/var/run/docker.sock:ro"
     - "/sys/fs/cgroup:/hostfs/sys/fs/cgroup:ro"
     - "/proc:/hostfs/proc:ro"
     - "/:/hostfs:ro"
   environment:
     - ELASTIC_USER=elastic
     - ELASTIC_PASSWORD=${ELASTIC_PASSWORD}
     - ELASTIC_HOSTS=https://es01:9200
     - KIBANA_HOSTS=http://kibana:5601
     - LOGSTASH_HOSTS=http://logstash01:9600
metricbeat.yml
metricbeat.config.modules:
  path: ${path.config}/modules.d/*.yml
  reload.enabled: false

metricbeat.modules:
- module: elasticsearch
  xpack.enabled: true
  period: 10s
  hosts: ${ELASTIC_HOSTS}
  username: ${ELASTIC_USER}
  password: ${ELASTIC_PASSWORD}
  ssl.certificate_authorities: "certs/ca/ca.crt"
  ssl.certificate: "certs/es01/es01.crt"
  ssl.key: "certs/es01/es01.key"

- module: logstash
  xpack.enabled: true
  period: 10s
  hosts: ${LOGSTASH_HOSTS}

- module: kibana
  metricsets:
    - stats
  period: 10s
  hosts: ${KIBANA_HOSTS}
  username: ${ELASTIC_USER}
  password: ${ELASTIC_PASSWORD}
  xpack.enabled: true

- module: docker
  metricsets:
    - "container"
    - "cpu"
    - "diskio"
    - "healthcheck"
    - "info"
    #- "image"
    - "memory"
    - "network"
  hosts: ["unix:///var/run/docker.sock"]
  period: 10s
  enabled: true

processors:
  - add_host_metadata: ~
  - add_docker_metadata: ~

output.elasticsearch:
  hosts: ${ELASTIC_HOSTS}
  username: ${ELASTIC_USER}
  password: ${ELASTIC_PASSWORD}
  ssl:
    certificate: "certs/es01/es01.crt"
    certificate_authorities: "certs/ca/ca.crt"
key: "certs/es01/es01.key"- Disable
metricbeat.ymlexecution permission and restart composer
chmod go-w metricbeat.yml
docker compose up
Now add out-of-the-box rules.
Go to: Menu > Management > Stack Monitoring
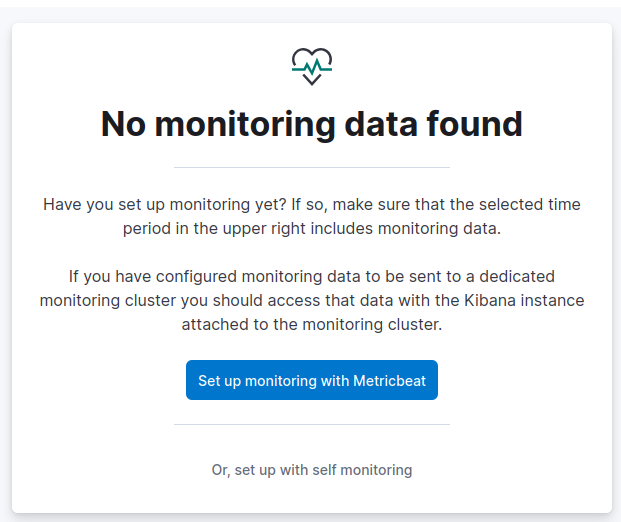
Here, official guide suggests Set up monitoring with Metricbeat but it didn’t find anything automatically, so I went with manual configuration.
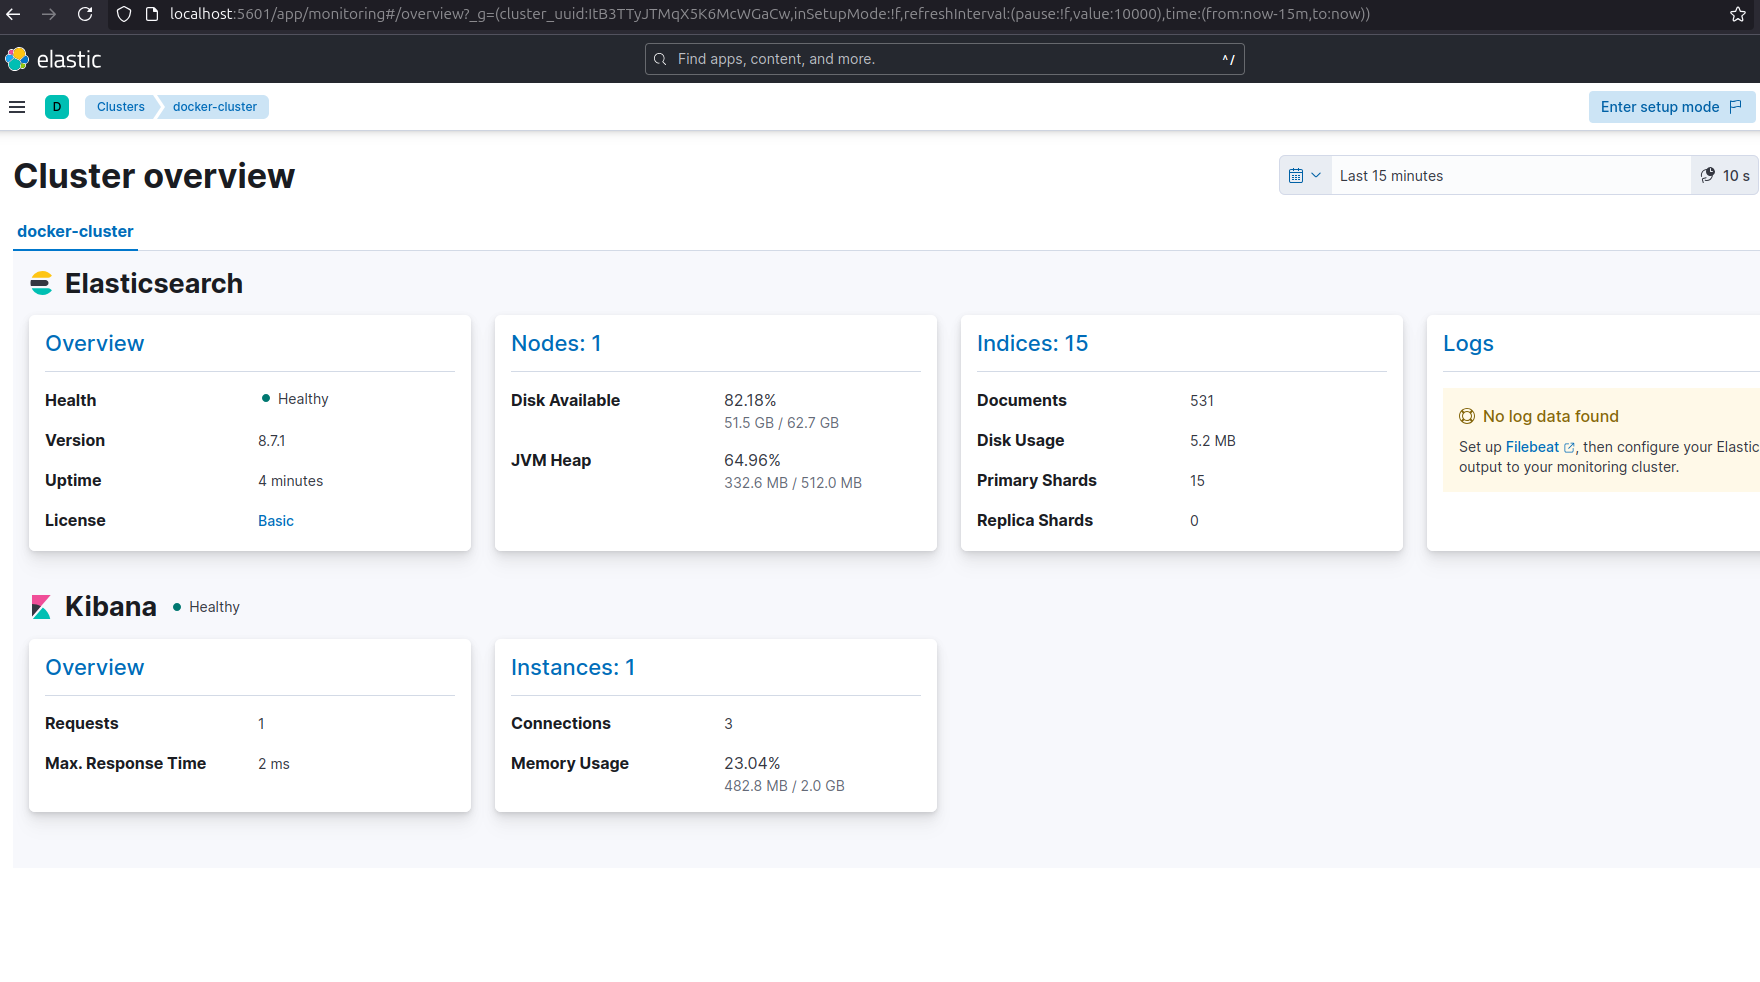
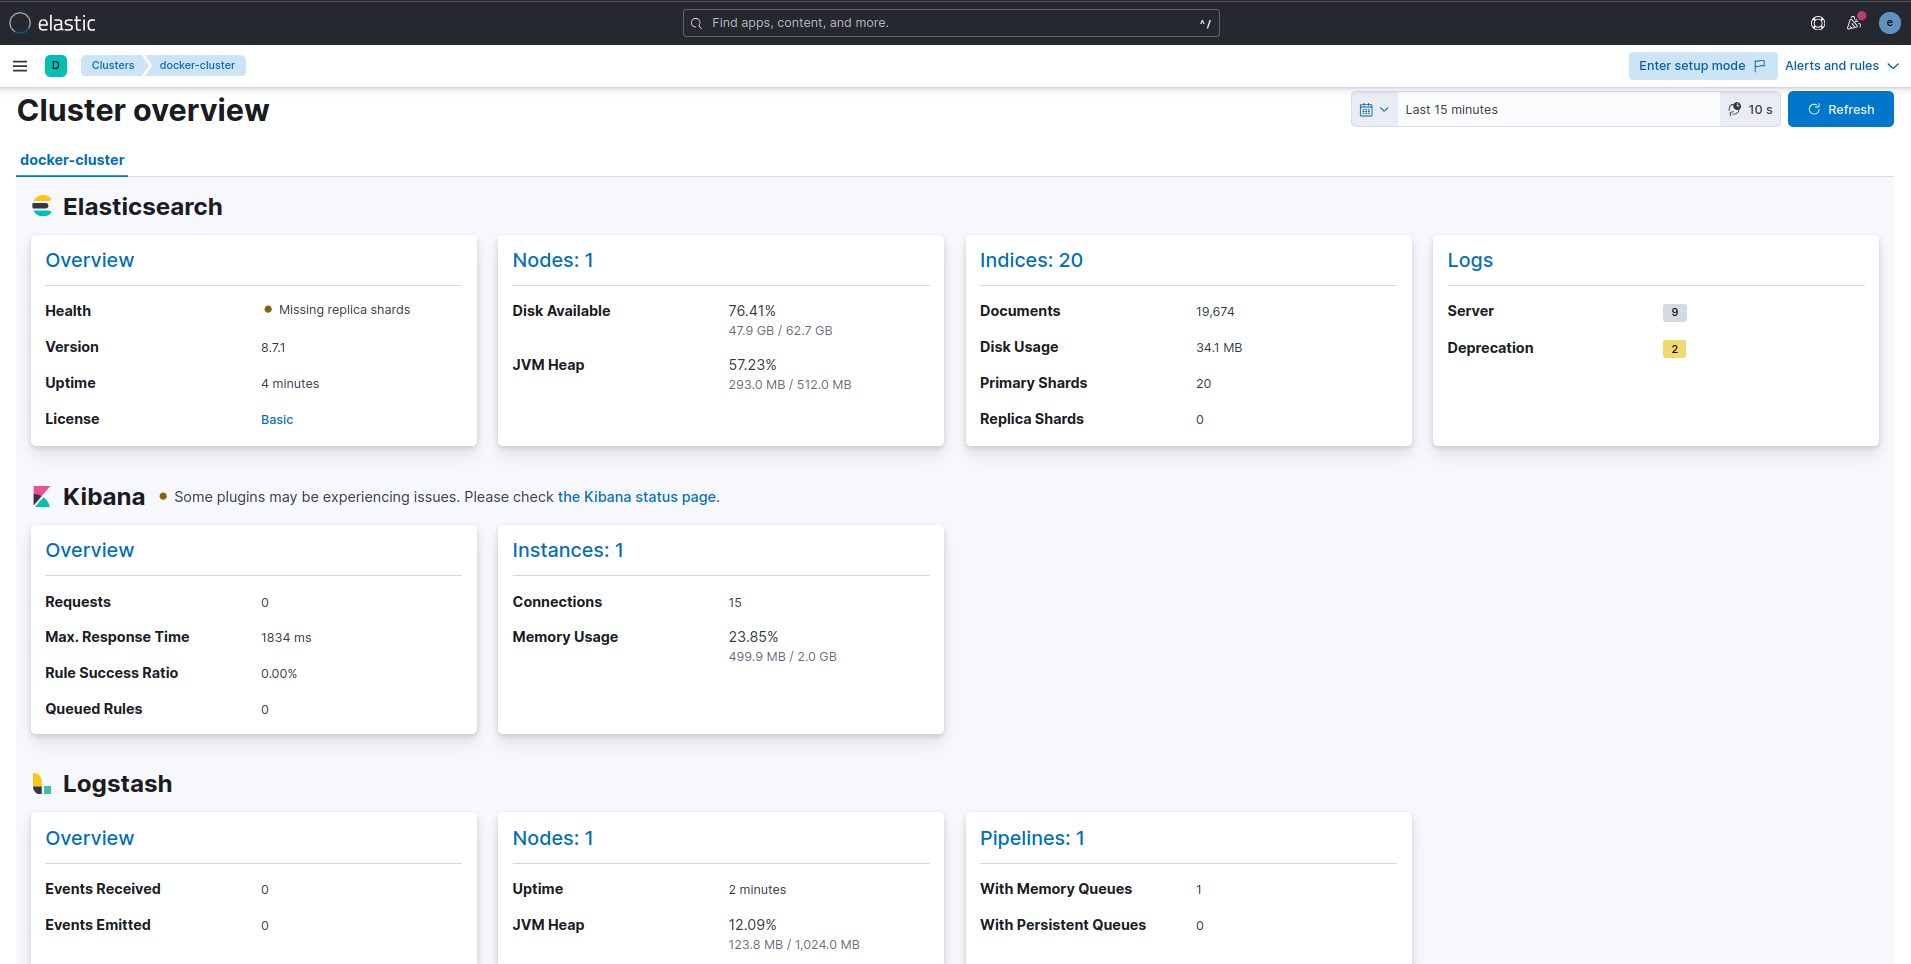
after configuring this step you should see the following in monitoring tab
Filebeat
Now that this cluster is stable and monitored with Metricbeat, we can install Filebeat for log ingestion.
docker-compose.yml
Append the following to docker-compose.yml
 filebeat01:
   depends_on:
     es01:
       condition: service_healthy
   image: docker.elastic.co/beats/filebeat:${STACK_VERSION}
   user: root
   volumes:
     - certs:/usr/share/filebeat/certs
     - filebeatdata01:/usr/share/filebeat/data
     - "./filebeat_ingest_data/:/usr/share/filebeat/ingest_data/"
     - "./filebeat.yml:/usr/share/filebeat/filebeat.yml:ro"
     - "/var/lib/docker/containers:/var/lib/docker/containers:ro"
     - "/var/run/docker.sock:/var/run/docker.sock:ro"
   environment:
     - ELASTIC_USER=elastic
     - ELASTIC_PASSWORD=${ELASTIC_PASSWORD}
     - ELASTIC_HOSTS=https://es01:9200
     - KIBANA_HOSTS=http://kibana:5601
     - LOGSTASH_HOSTS=http://logstash01:9600
filebeat.yml
filebeat.inputs:
- type: filestream
  id: default-filestream
  paths:
    - ingest_data/*.log

filebeat.autodiscover:
 providers:
   - type: docker
     hints.enabled: true

processors:
- add_docker_metadata: ~


setup.kibana:
 host: ${KIBANA_HOSTS}
 username: ${ELASTIC_USER}
 password: ${ELASTIC_PASSWORD}


output.elasticsearch:
 hosts: ${ELASTIC_HOSTS}
 username: ${ELASTIC_USER}
 password: ${ELASTIC_PASSWORD}
 ssl.enabled: true
 ssl.certificate_authorities: "certs/ca/ca.crt"
disable filebeat.yml execution permission and restart container
chmod go-w filebeat.yml
docker compose up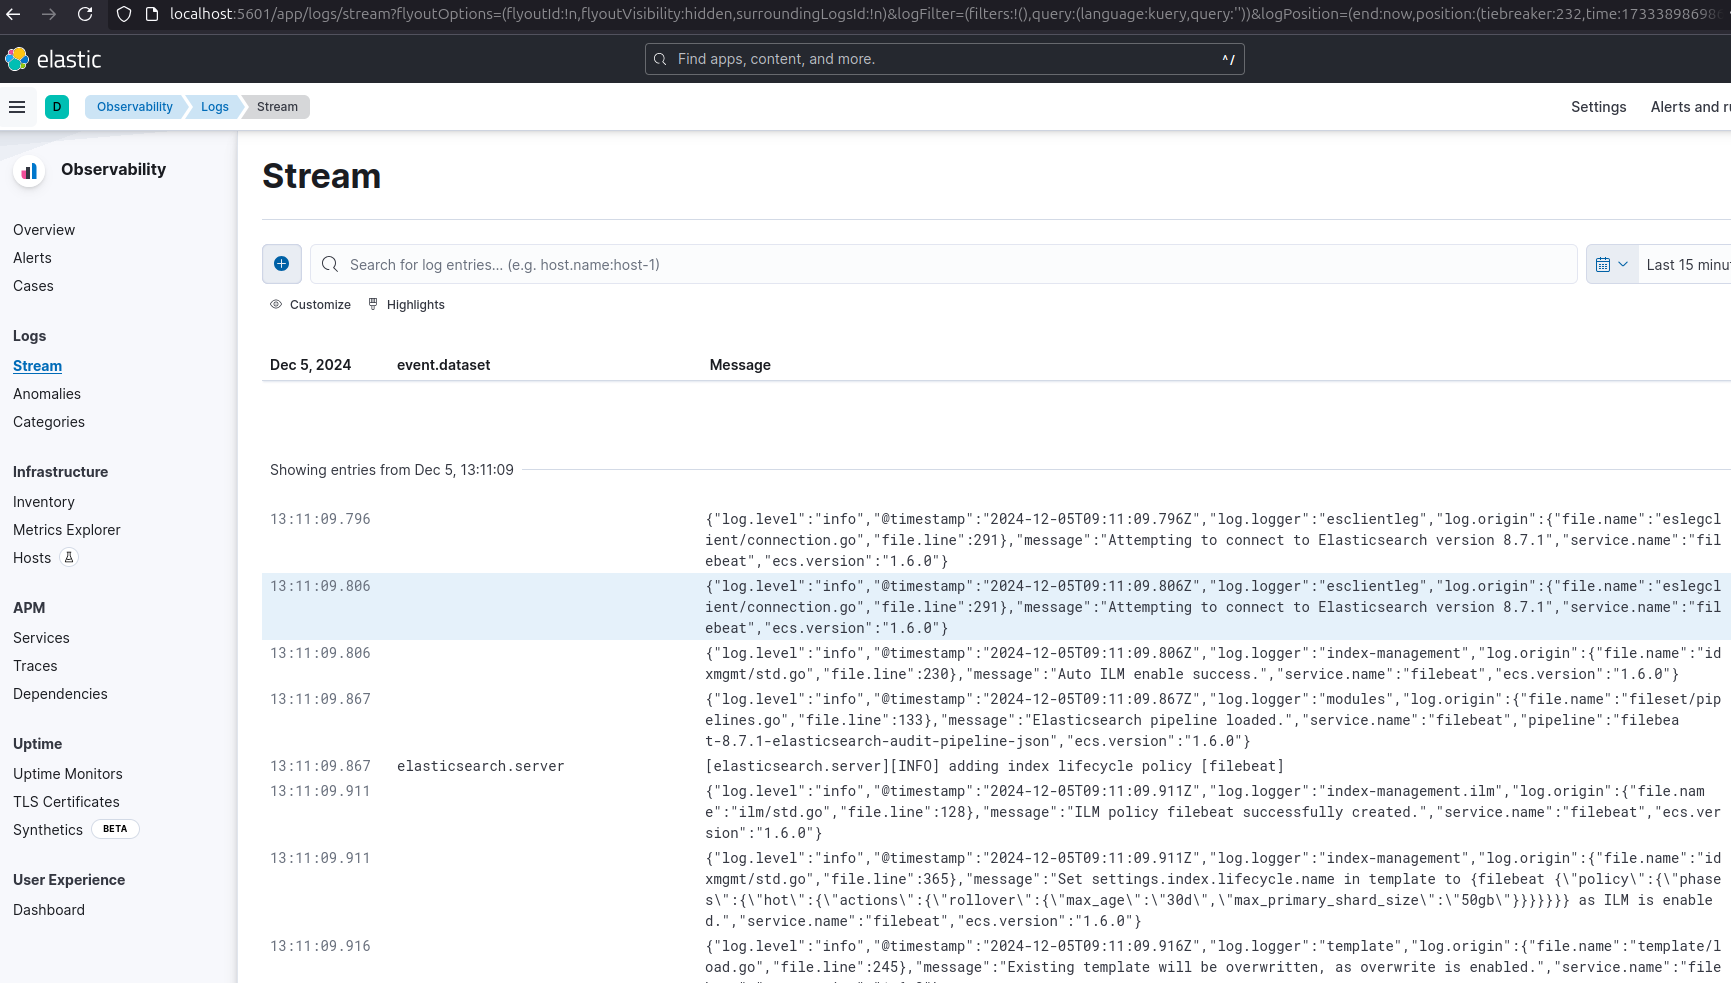
Logstash
Final container I’m going to setup is logstash which will help us to manage and transform logs.
docker-compose.yml (’logstash01’ container)
Add the following to docker-compose.yml
 logstash01:
   depends_on:
     es01:
       condition: service_healthy
     kibana:
       condition: service_healthy
   image: docker.elastic.co/logstash/logstash:${STACK_VERSION}
   labels:
     co.elastic.logs/module: logstash
   user: root
   volumes:
     - certs:/usr/share/logstash/certs
     - logstashdata01:/usr/share/logstash/data
     - "./logstash_ingest_data/:/usr/share/logstash/ingest_data/"
     - "./logstash.conf:/usr/share/logstash/pipeline/logstash.conf:ro"
   environment:
     - xpack.monitoring.enabled=false
     - ELASTIC_USER=elastic
     - ELASTIC_PASSWORD=${ELASTIC_PASSWORD}
     - ELASTIC_HOSTS=https://es01:9200
logstash.conf
input {
 file {
   #https://www.elastic.co/guide/en/logstash/current/plugins-inputs-file.html
   #default is TAIL which assumes more data will come into the file.
   #change to mode => "read" if the file is a compelte file.  by default, the file will be removed once reading is complete -- backup your files if you need them.
   mode => "tail"
   path => "/usr/share/logstash/ingest_data/*"
 }
}

filter {
}

output {
 elasticsearch {
   index => "logstash-%{+YYYY.MM.dd}"
   hosts=> "${ELASTIC_HOSTS}"
   user=> "${ELASTIC_USER}"
   password=> "${ELASTIC_PASSWORD}"
   cacert=> "certs/ca/ca.crt"
 }
}
Restart composer.
NOTE
Now, to actually see the logstash data index, you need to add sample log files in logstash_ingest_data and filebeat_ingest_data first.
For that, I used Mockaroo to create sample log file.
Download and rename it from .csv to .log files.
My mock data test_log.log looks like the following
time,id,first_name,last_name,email,mac_address,ip_address,hash
4/17/2024,1,Rania,Cressey,rcressey0@reference.com,F9-E0-79-93-F6-DA,130.148.172.136,51ba1df5efb4de21b434d94d1e72615b57c30721
12/30/2023,2,Gerhard,Mewton,gmewton1@businessinsider.com,CA-36-6B-25-5B-16,187.64.188.232,9afff3f236157637cdf36f3a116b3f5d3ac3deb0
9/1/2024,3,Anabel,Musk,amusk2@opensource.org,FF-AB-36-D7-DA-E3,105.172.167.115,31f37d280ddf812083dbce74c9a0491b62bacfbd
4/29/2024,4,Mike,Stannas,mstannas3@jalbum.net,D0-B4-C0-DD-B0-00,70.70.51.36,4ed691e0ebd4c17dd2125a460bd92f6ca37cd095
8/1/2024,5,Tadd,Nurden,tnurden4@webmd.com,FA-EC-F3-2C-A4-4E,101.82.60.252,dc5e68d384de61e69fe0798deab41f65040cca56
6/12/2024,6,Neall,Vaulkhard,nvaulkhard5@ucsd.edu,36-78-C0-8B-4C-EF,47.129.241.26,456b8cfcc04155848d993790be677a374a910cb8
2/12/2024,7,Lilli,Linnane,llinnane6@blinklist.com,29-7E-61-0D-27-BA,196.177.55.60,d9c33fe2e9c21d31f88801402606d998c35f80dd
8/3/2024,8,Ianthe,Antognetti,iantognetti7@imdb.com,5E-F1-AF-90-E0-81,121.223.169.75,a17aa33138a84ee53283012338c9c1f0d9c324c9
9/9/2024,9,Piper,Victor,pvictor8@usatoday.com,0E-6D-6C-9B-43-1A,160.228.92.124,6e609309d997e6fa708cdcef0b11425c3bf84341
Which I dropped in logstash_ingest_data/ and filebeat_ingest_data/.
Now it’ll take a few seconds for Elastic to see the changes in Menu > Stack management > Index management > Reload Indices
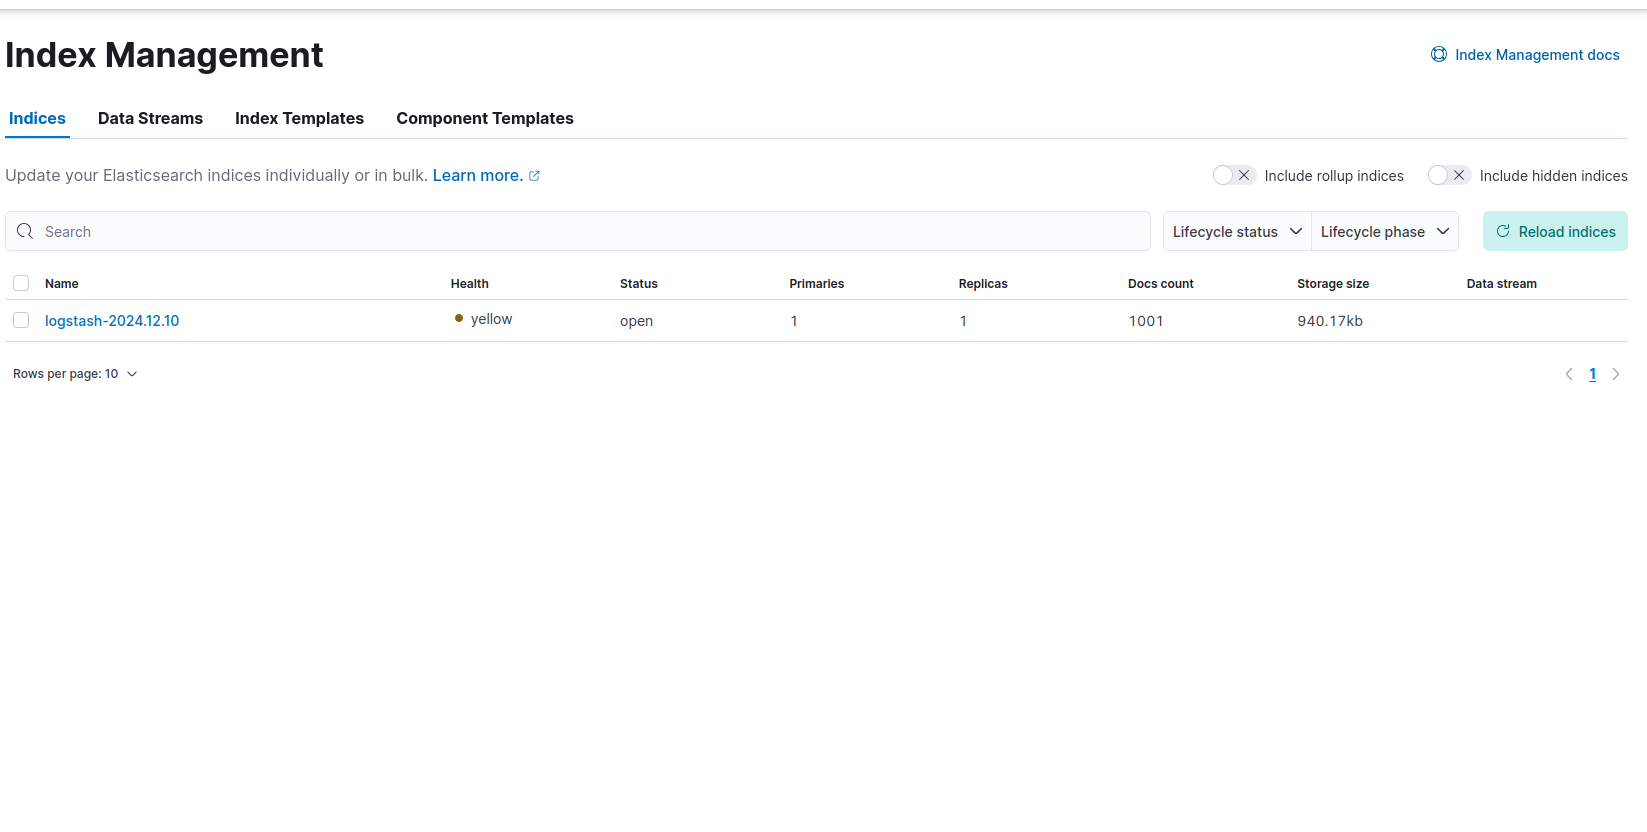
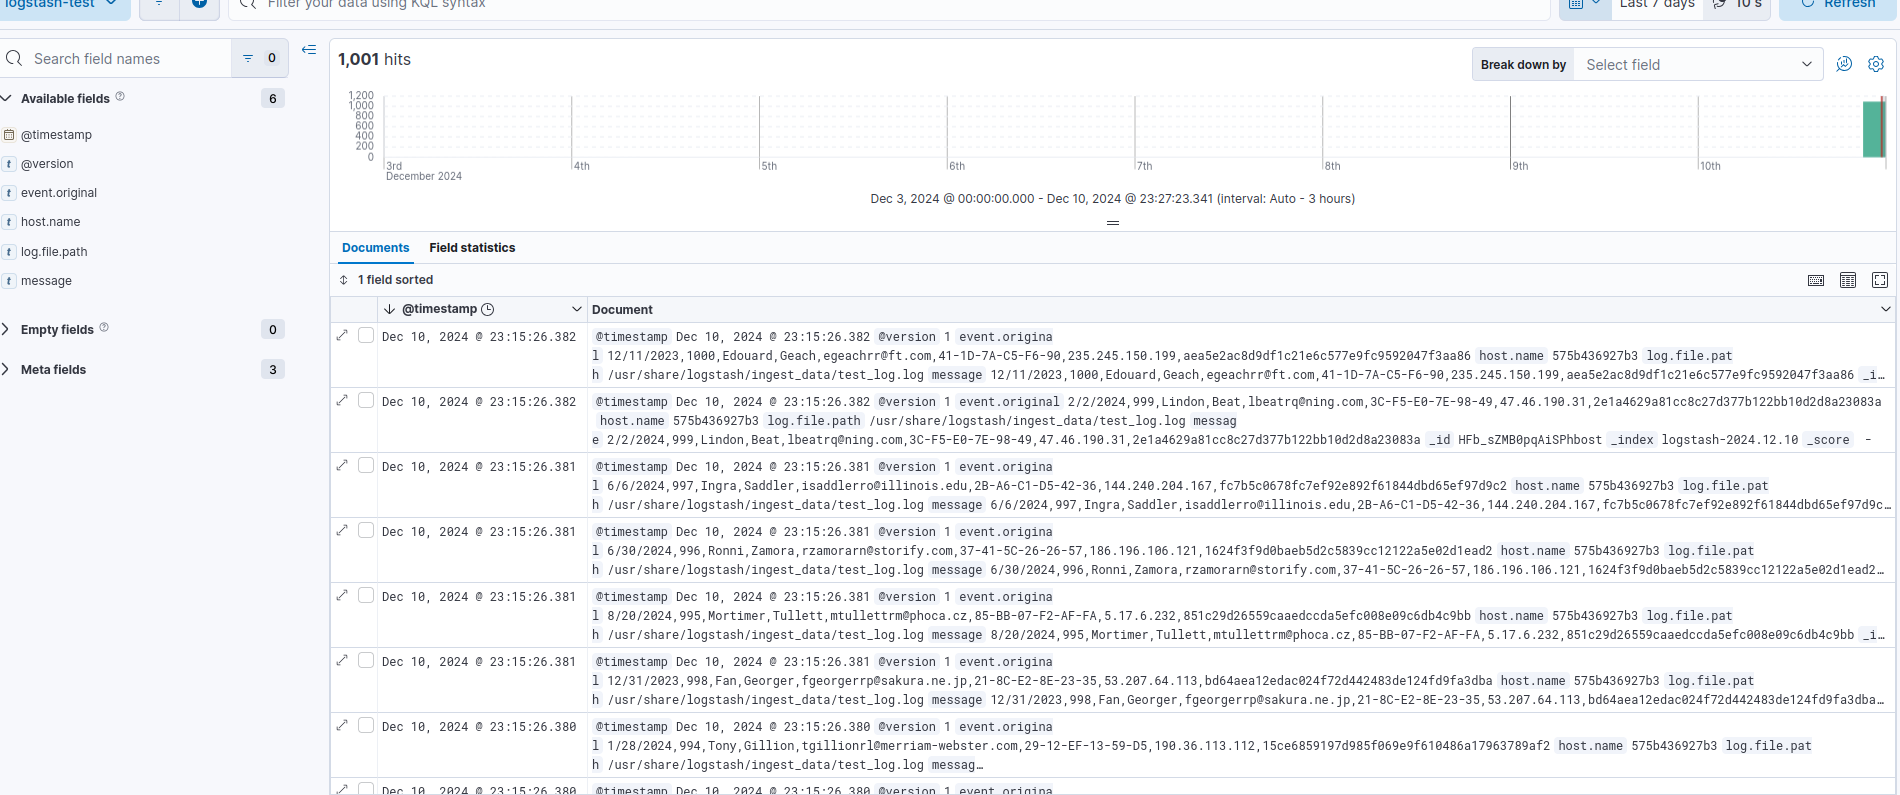
And here should be logstash data logs.
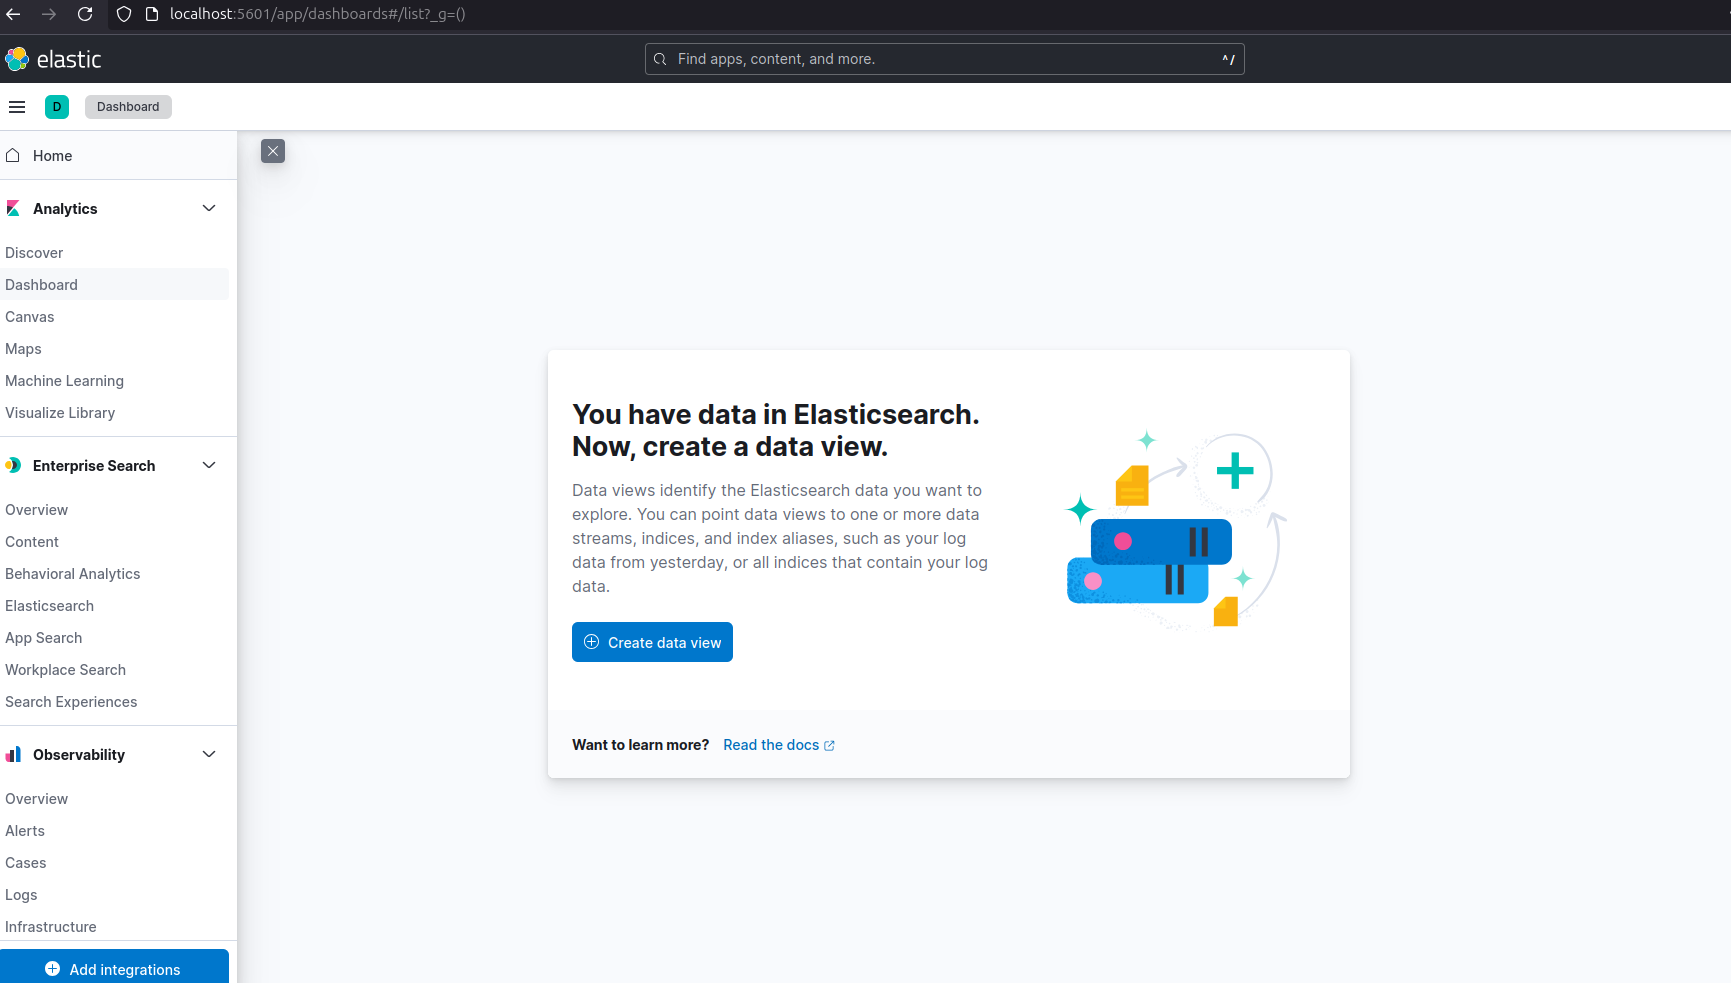
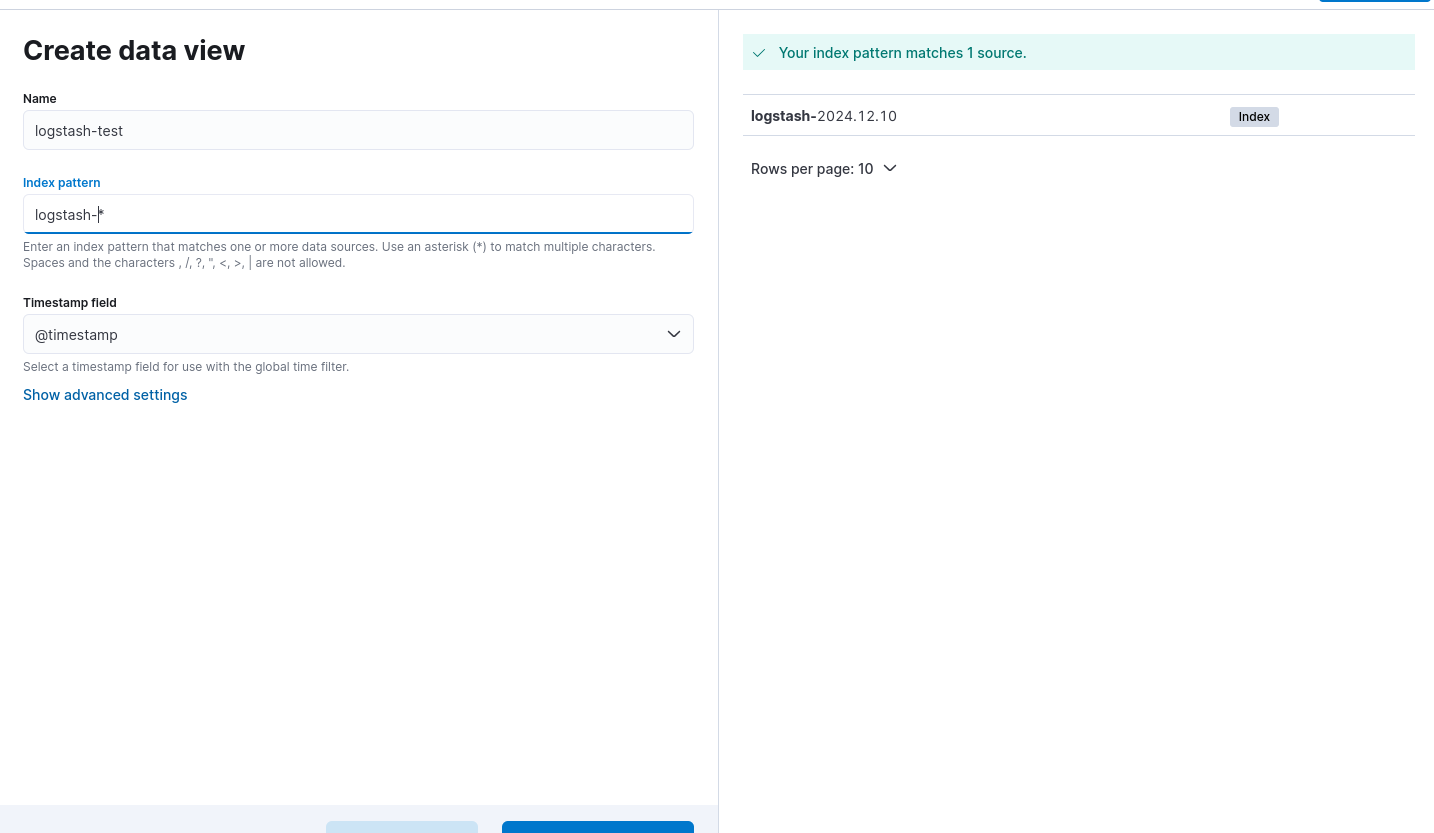
Now, to see the data, I need to create Data View for the “logstash- *” pattern.
Go to: Menu > Analytics > Discover > Create data view
If you finished all the steps successfuly, you should see the following stack setup in the Stack Monitoring tab
Conclusion
In this article, I demonstrated how it is possible to set-up ELK Stack in its basic form.
The files for this setup is uploaded on my github page for public availability.
In the next part, I’ll look at more advanced configuration of Elastic.
Until then.